US Healthcare Analysis
Overview
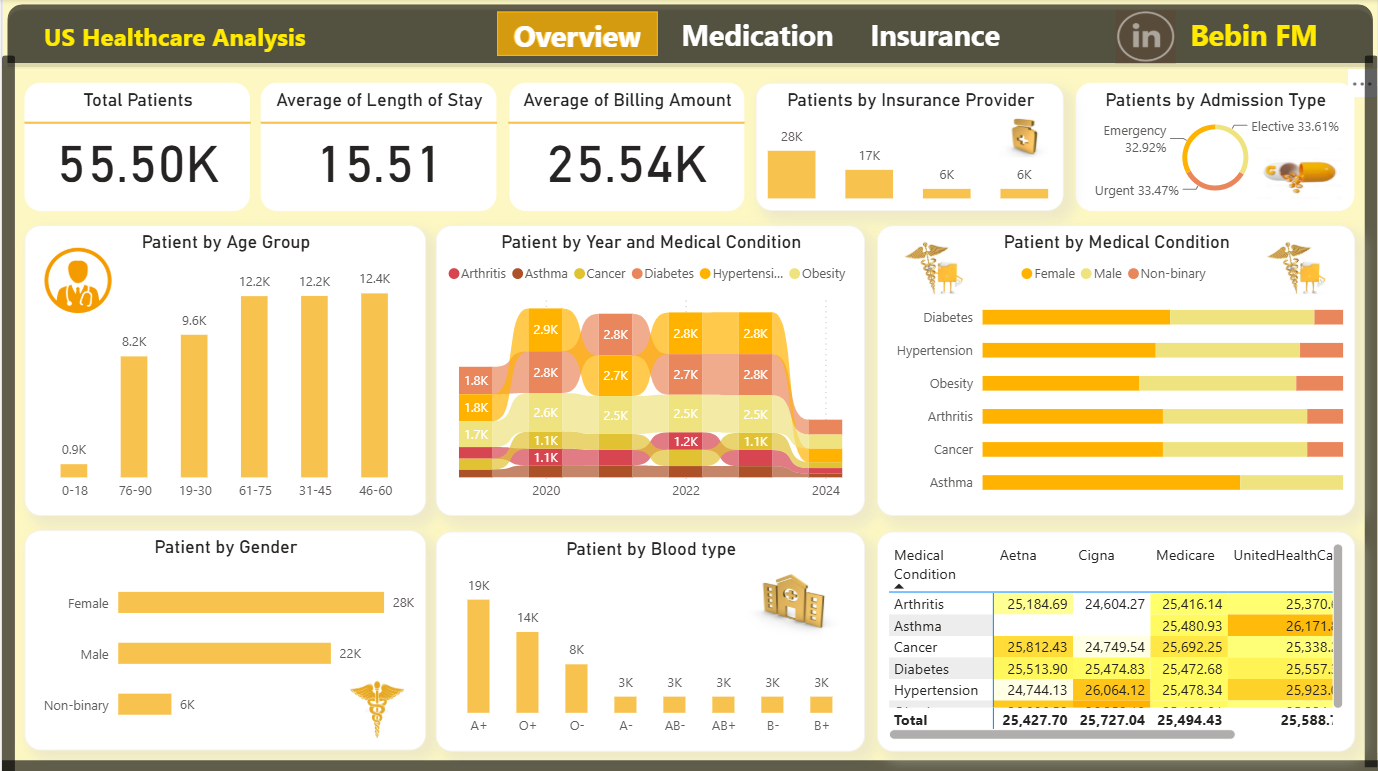
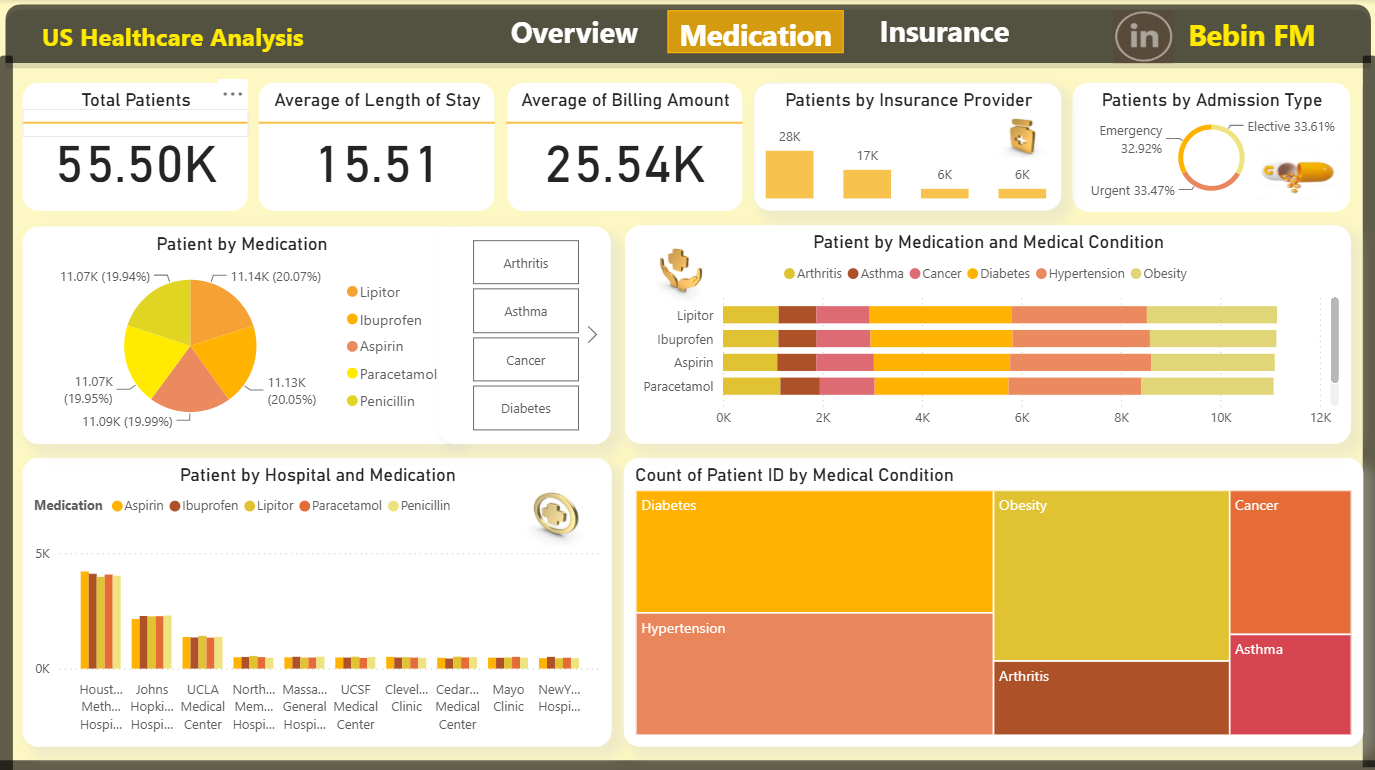
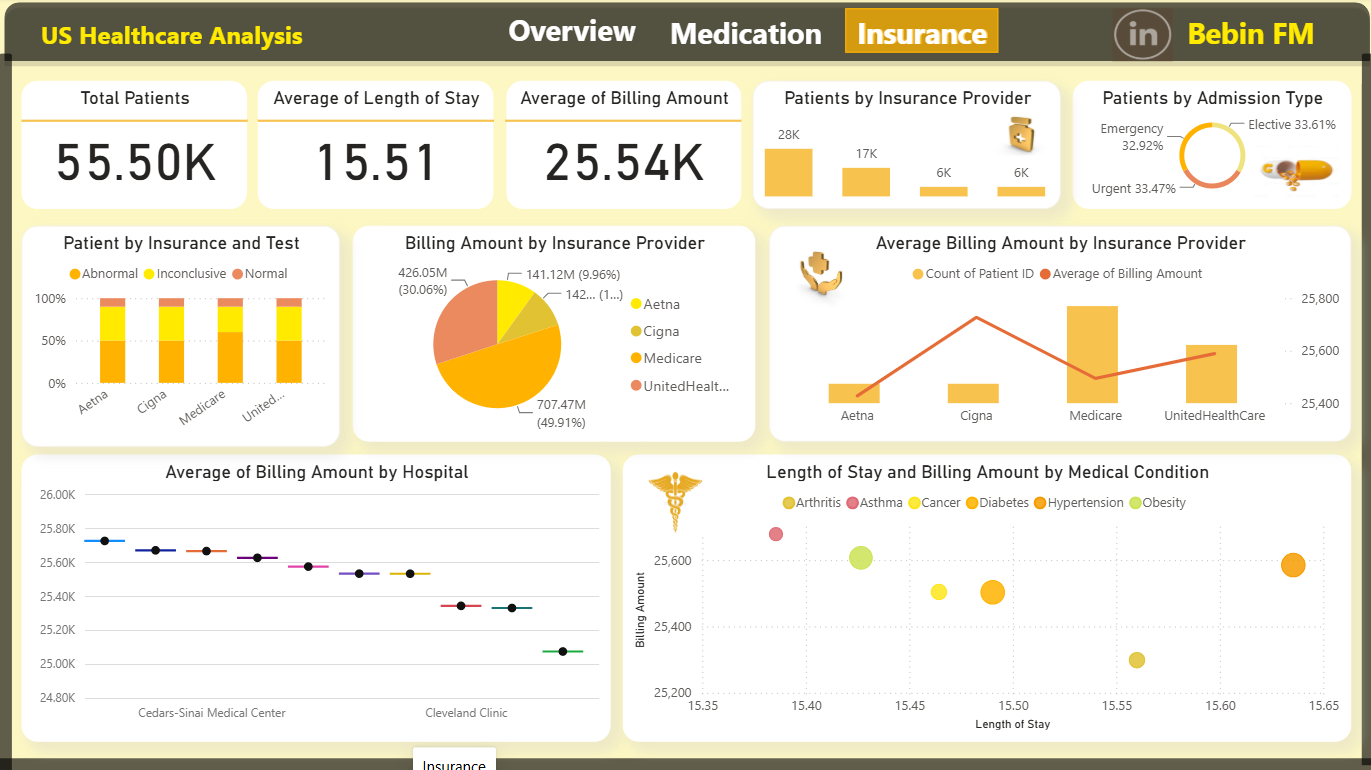
Developed an interactive US Healthcare Analysis Dashboard in Power BI to analyze over 55K patient records, providing insights into patient demographics, hospital performance, insurance providers, medication usage, and healthcare billing. The dashboard combines KPIs and interactive visualizations to help healthcare stakeholders monitor operational performance and support data-driven decision-making.
Objective
To build a centralized healthcare analytics solution that enables hospitals and healthcare administrators to monitor patient trends, analyze billing performance, evaluate insurance providers, and explore treatment patterns through interactive business intelligence dashboards.
Tools
Power BI • DAX • Power Query • Data Modeling • Healthcare Analytics
Highlights
- • Built a 3-page interactive dashboard covering Overview, Medication, and Insurance analysis.
- •Designed KPI cards to track Total Patients (55.5K), Average Length of Stay (15.51 days), and Average Billing Amount ($25.54K).
- •Analyzed patient demographics by age group, gender, blood type, admission type, and medical condition.
- •Compared insurance providers based on patient volume and billing performance.
- •Explored medication usage across hospitals and medical conditions using interactive charts and filters.
- •Visualized hospital billing trends, insurance performance, and treatment insights using advanced Power BI visuals.
- •Implemented DAX measures, Power Query transformations, slicers, bookmarks, and cross-filtering for an interactive reporting experience.