Prime Video Analysis Dashboard
Overview
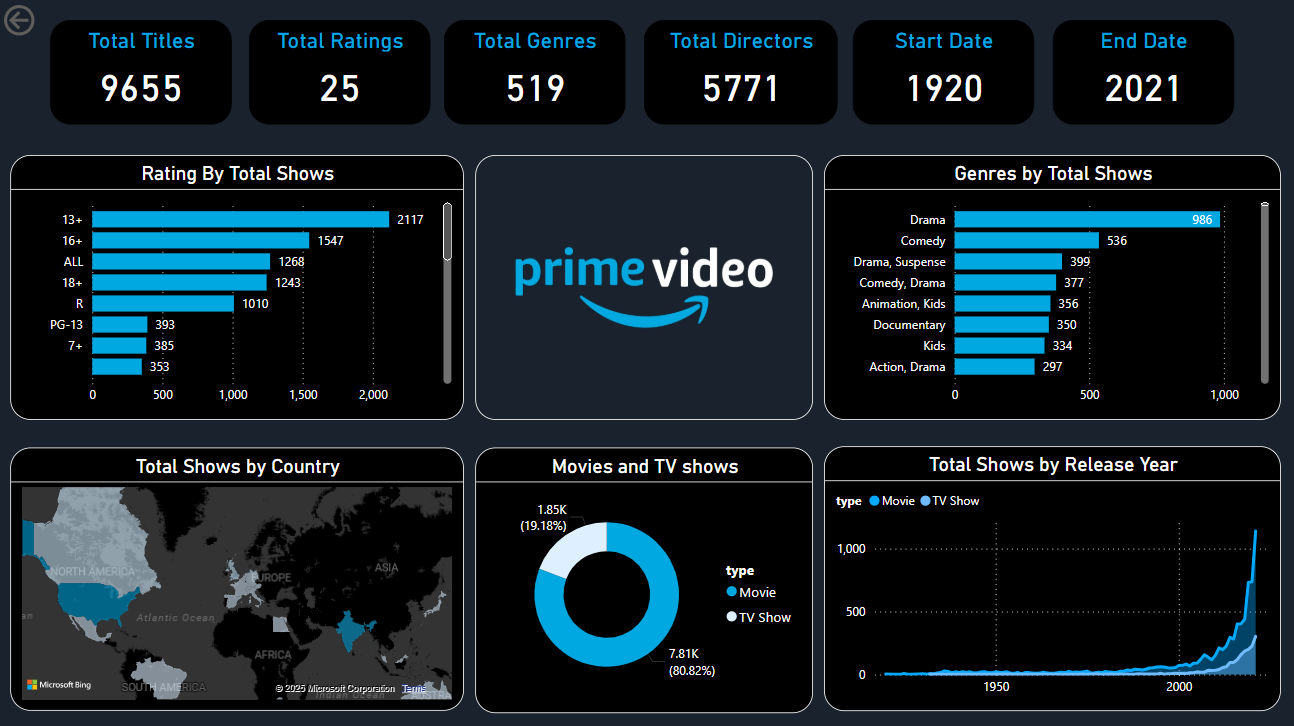
Developed an interactive Amazon Prime Video Analytics Dashboard in Power BI to analyze content distribution, ratings, genres, release trends, and global availability. The dashboard provides valuable insights into the Prime Video content library, enabling users to explore movies and TV shows based on genre, certification, country, and release year through dynamic visualizations.
Objective
To build a centralized entertainment analytics dashboard that helps users understand Prime Video's content catalog by analyzing title distribution, genre popularity, audience ratings, geographical availability, and release trends, supporting data-driven content and business analysis.
Tools
Power BI • DAX • Power Query • Data Modeling • Entertainment Analytics
Highlights
- Developed an interactive content analytics dashboard to explore Prime Video's library of 9,655 titles.
- Designed KPI cards to monitor Total Titles, Ratings, Genres, Directors, and Content Release Timeline (1920–2021).
- Analyzed content distribution across Movies and TV Shows, identifying their contribution to the overall catalog.
- Explored genre popularity, highlighting the most common genres such as Drama, Comedy, and Documentary.
- Visualized audience classifications using content ratings (13+, 16+, PG-13, R, etc.).
- Mapped global content availability through an interactive country-wise visualization.
- Tracked content growth over time using release year trend analysis to identify expansion patterns in the Prime Video catalog.
- Implemented DAX measures, Power Query transformations, slicers, and interactive visualizations to deliver an engaging business intelligence solution.