Merchant Sales Analysis Dashboard
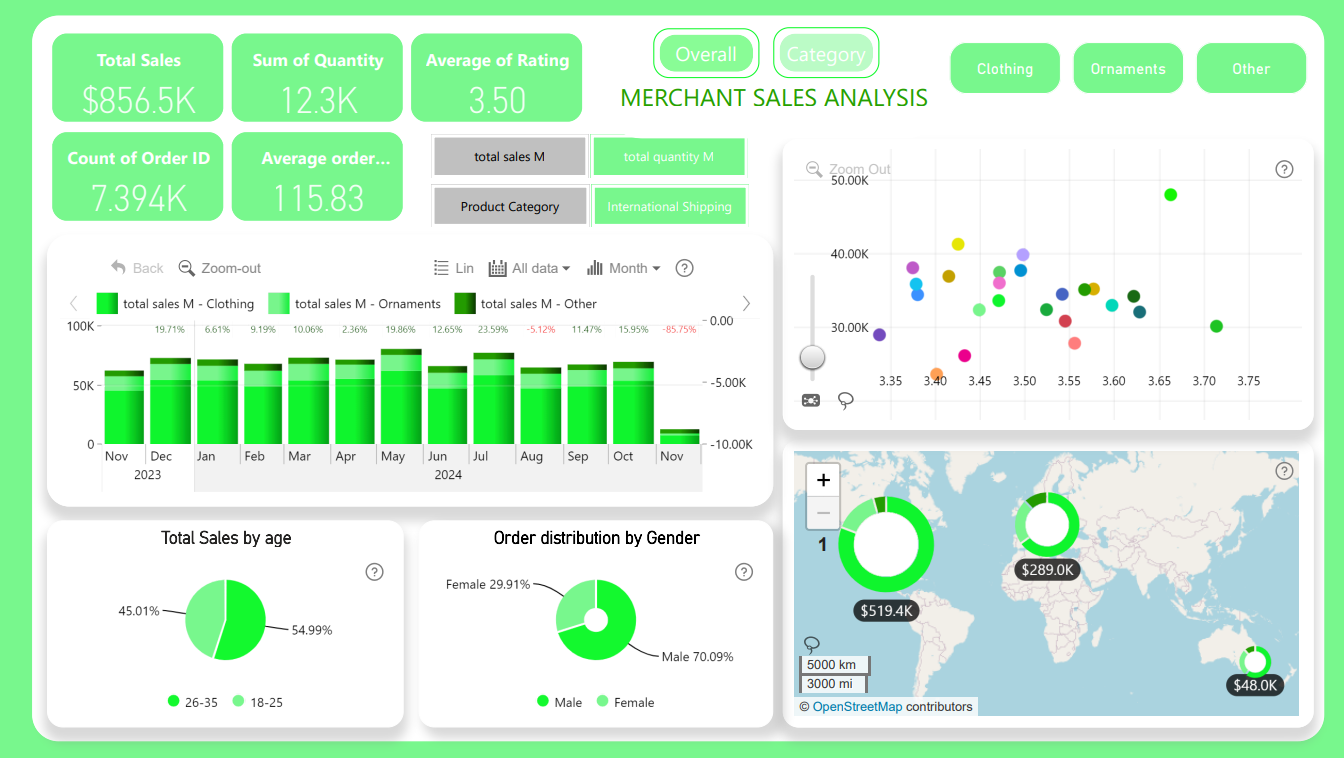
Overview
Developed an interactive Merchant Sales Analysis Dashboard in Power BI to analyze sales performance, customer purchasing behavior, product categories, and geographic sales distribution. The dashboard provides business stakeholders with actionable insights into revenue trends, order patterns, customer demographics, and regional performance through dynamic visualizations.
Objective
To build a centralized business intelligence dashboard that enables merchants to monitor sales performance, evaluate customer purchasing trends, analyze product category performance, and identify regional sales opportunities for informed business decision-making.
Tools
Power BI • DAX • Power Query • Data Modeling • Sales Analytics
Highlights
- Built an interactive sales dashboard featuring Overall and Category-level analysis with dynamic navigation.
- Designed KPI cards to monitor Total Sales ($856.5K), Total Quantity Sold (12.3K), Average Rating (3.50), Total Orders (7.39K), and Average Order Value ($115.83).
- Analyzed monthly sales trends across multiple product categories, including Clothing, Ornaments, and Other.
- Explored customer purchasing behavior using demographic insights such as age group and gender distribution.
- Visualized regional sales performance with an interactive map, highlighting sales across different geographic locations.
- Used scatter plots to identify relationships between customer ratings and sales performance.
- Implemented DAX measures, Power Query transformations, slicers, bookmarks, drill-through, and cross-filtering to create an engaging and interactive reporting experience.