AWESOME Cholocates Sales Analysis Dashboard
Overview
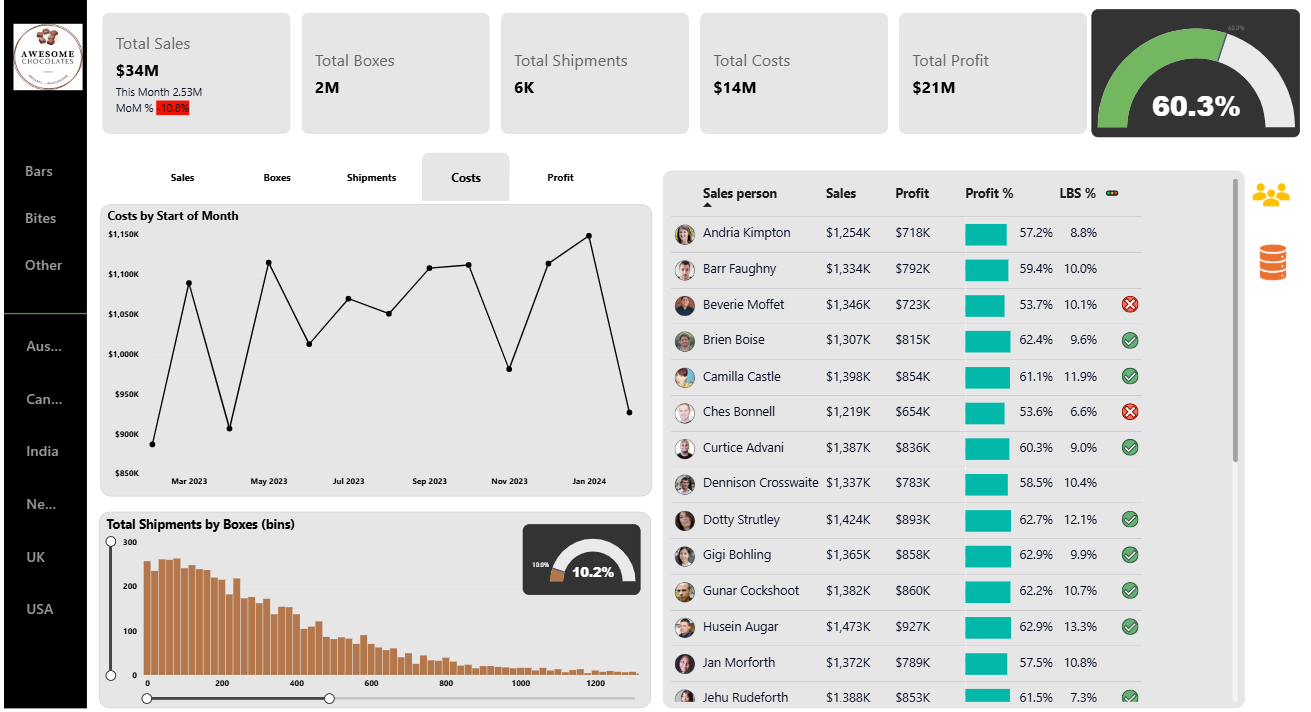
Designed an interactive Chocolate Sales Performance Dashboard in Power BI to monitor sales, profitability, shipments, product performance, and regional trends. The dashboard provides business stakeholders with a comprehensive view of key sales metrics, operational efficiency, and salesperson performance to support data-driven decision-making.
Objective
To develop a centralized sales analytics solution that enables businesses to track revenue, profit, costs, shipment performance, and sales trends across products, regions, and sales representatives, helping improve operational and financial performance.
Tools
Power BI • DAX • Power Query • Data Modeling • Sales Analytics
Highlights
- Built a multi-page interactive dashboard covering Sales, Boxes, Shipments, Costs, and Profit analysis.
- Designed KPI cards to monitor Total Sales ($34M), Total Profit ($21M), Total Costs ($14M), Total Boxes (2M), and Total Shipments (6K).
- Analyzed monthly cost and sales trends to identify seasonal business performance.
- Evaluated salesperson performance using sales, profit, profit margin, and shipment efficiency metrics.
- Visualized shipment distribution and operational patterns using histograms and gauge charts.
- Enabled dynamic filtering by country, product category, and business metrics for deeper analysis.
- Implemented DAX measures, Power Query transformations, slicers, bookmarks, and interactive visualizations for an intuitive reporting experience.